After reading this essay you will learn about: 1. Introduction to Foreign Trade in India 2. Trends in the Value of Foreign Trade in India 3. Peculiarities of Foreign Trade during Eighties 4. Composition of Foreign Trade in India 5. Directions of Foreign Trade in India 6. Foreign Trade Policy of India.
List of Essays on Foreign Trade in India
Essay Contents:
- Essay on the Introduction to Foreign Trade in India
- Essay on the Trends in the Value of Foreign Trade in India
- Essay on the Peculiarities of Foreign Trade during Eighties
- Essay on the Composition of Foreign Trade in India
- Essay on the Directions of Foreign Trade in India
- Essay on the Foreign Trade Policy of India
Essay # 1.
Introduction to Foreign Trade in India:
Since the introduction of planning in the country, India had to depend heavily on the imports of various types of machineries and equipment’s for the development of various types of industries in the country. Such imports were known as developmental imports.
At that stage, India had to import capital goods extensively in order to set up various industries like steel plants, locomotives, hydro-electric projects etc. In the next stage, India had to import a huge quantity of intermediate goods and raw materials in order to utilise the productive capacity developed in the initial periods. This type of imports was known as maintenance imports.
Thus the developmental process of a developing country like India in its initial stages was very much depending on developmental and maintenance imports.
Moreover, in order to meet the scarcity of some essential commodities, the government has also imported food grains and other consumer goods. This type of imports was considered as anti-inflationary imports. In order to meet its mounting import bill, the country started to export various types of primary products at initial stage.
But with the growth of various types of manufacturing industries and engineering industries, the country started to withdraw these traditional items of export and gradually established a good market for its manufactured and semi-manufactured commodities. Thus foreign trade has been helping the country in different stages of its economic development.
Essay # 2. Trends in the Value of Foreign Trade in India:
In order to have a clear idea about the trend in the value of foreign trade in the country since the inception of planning, it would be better to study the value of foreign trade (value of imports plus exports) in India since 1950-51. For bringing impartiality in the data, all figures of foreign trade have been transformed in post- devaluation (devaluation of 1966) rates.
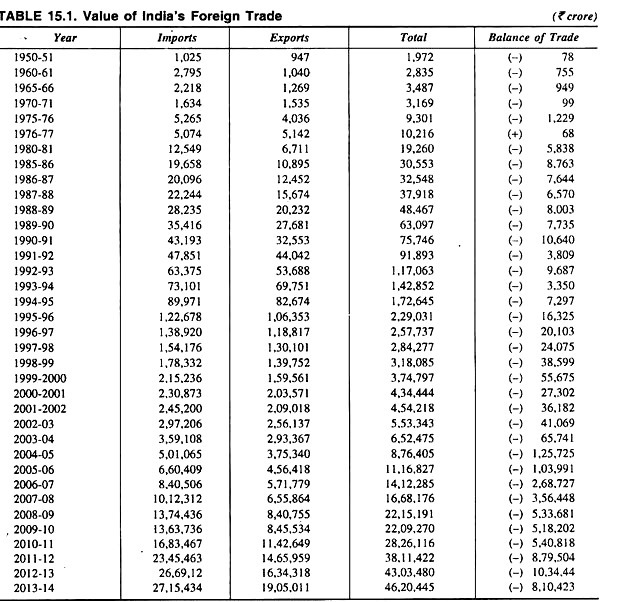
Table 15.1 shows the changes in the value of foreign trade in India since 1950-51.
(i) Huge Growth in the Value of Trade:
Table 15.1 reveals that the total value of foreign trade which was Rs 1972 crore in 1950-51, gradually increased to Rs 2,835 crore in 1960-61 and then to Rs 3,487 crore in 1965-66. After that the value of trade increased at a quicker pace from 3169 crore in 1970-71 to Rs 9,301 crore in 1975-76 and then rose significantly to Rs 19,260 crore in 1980-81.
Thereafter, the total value of trade rose significantly to Rs 30,553 crore in 1985-86 to Rs 63,097 crore in 1989-90 and to Rs 91,893 crore in 1991-92 and then to Rs 1,17,063 crore in 1992-93 and finally to Rs 46,20,445 crore in 2013-14.
Thus during the period from 1950-51 to 1970-71, total value of trade rose by only 60.9 per cent. Again during the period 1970-71 to 1980-81, total value of foreign trade rose significantly by 507 per cent, i.e., by nearly 6 times. But during the period 1980-81 to 1990-91, total value of trade rose by 293.3 per cent, i.e., by nearly 4 times. In 2013-14 the value of trade recorded an increase of 7.36 per cent over the previous year.
(ii) Higher Growth of Imports:
Another peculiarity that can be seen from this trend is that there has been consequential higher growth in respect of imports of the country since 1951. Thus the total value of imports which was Rs 1,025 crore in 1950-51 gradually rose to Rs 1,634 crore in 1970-71, i.e., by only 59 per cent.
Since then the value of imports started to rise at a very faster pace and thus reached the level of Rs 12,549 crore in 1980-81 and then to Rs 43,193 crore in 1990-91 showing an increase of 667 per cent and 244 per cent during the last two decades respectively.
Factors which were largely responsible for this phenomenal increase in imports include: huge import of industrial inputs, regular import of food-grains under P.L. 480 rising anti- inflationary imports, liberal imports of non-essential items, periodic hike on oil prices and the initiation of liberal import policy by the Government during 1985-86 to 1991-92.
In 2013-14, the value of imports rose significantly to Rs 27,15,434 crore, showing a growth rate of 1.73 per cent over the previous year.
(iii) Inadequate Growth of Exports:
Another very peculiar situation that the country has been facing is a very slow growth in respect of its exports. In the initial period, total value of exports in India rose marginally from Rs 947 crore in 1950-51 to Rs 1,535 crore in 1970-71, showing an increase of only 62 per cent. But since then the growth of exports in the country could not keep pace with the growth in imports.
Total value of exports rose gradually to Rs 6,711 crore in 1980-81 showing an increase of 337 per cent over 1970-71 and then to Rs 32,553 crore in 1990-91, showing an increase of 385 per cent over the value of 1980-81. In 1993-94, the value of exports rose considerably to Rs 69,751 crore showing a growth of 29.9 per cent over the previous year.
In 2012-2013, the value of exports rose to Rs 16,34,318 crore showing a growth rate of 11.46 per cent over the previous year. Again in 2013-14 the value of exports stood at Rs 19,05,011 crore showing a positive growth of 16.5 per cent over the previous year.
Due to the introduction of various export promotion measures since the devaluation of rupee in 1966, the value of Indian exports recorded some increase but this increase in exports was totally inadequate considering the sizeable growth in the value of imports.
This has resulted in a persistent and widening trade deficit in the country. The factors which were mostly responsible for this low growth of exports include unfavorable terms of trade for Indian primary (agro-based) goods, inadequate export surplus, adoption of the policy of protectionism by developed countries and long period of business recession in developed country in recent years.
Reasons of Slow Export growth: Survey Findings:
Recently a survey conducted by the Delhi School of Business on 150 export organisations revealed that the main reasons for the slow growth of exports in India were that 65 per cent of the export establishments were not using ITPO, MMTC and other such institutions.
Moreover, a majority of the establishments were not inclined to make use of training and education in international marketing. Clearly, lack of adequate professionally trained manpower in export organizations is one of the important reasons for slow growth of exports in the country and failure to compete effectively in global markets.
Some of important factors which were found responsible for reduction in growth of exports from 20 per cent to a mere four per cent during the last two years (1996-98) were Government policies, quality of production, tariffs, quality control and management, institutional finance, banks, export procedures and participation in trade fairs.
It was also observed that as many as 47 per cent of the exporters would not like to avail of the services of personnel trained in export and would manage their operations through family members or others not professionally trained.
The study also highlighted an attitudinal disinclination towards professionalism. Thereby, as many as 56 per cent of the respondents were not inclined to sponsor a candidate for training international marketing.
As per this survey, dominant constraints and problems faced by the exporters were lack of export marketing information, inadequate infrastructural facilities, procedural complications, monetary loss due to low export prices and delay in clearance in ports. Therefore, immediate improvement or upgrading was required in port handling facilities, road transportation, rail transport and power sectors.
Regarding shipments, the biggest constraints were high incidence of warehousing cost, delay in customs clearance, inadequate warehousing facilities, low frequency of sailing, high incidence of port expenses and inadequate shipping space.
It is quite disturbing to note that India’s share in world trade was 1.78 per cent in 1950 and in-spite of all the efforts made it has come down to 0.61 per cent in 1994. Immediately after liberalisation, there were positive signs up to 1995 but in 1996 and 1997 there had been a reversal of the trend.
In-spite of the constraints and inadequacies faced by the exporters it was heartening to note that the exporting community, as observed by the survey, was optimistic about the future scenario.
(iv) Mounting Trade Deficit: Deficit in the Balance of Trade:
As a result of higher growth of imports and slow growth of exports the country has been experiencing a mounting trade deficit since 1980-81. During the last 45 years period, the country has recorded a small surplus in its trade only in two years (viz., in 1972- 73 and in 1976-77). Due to adverse balance of trade situation, the extent of trade deficit in India gradually rose from Rs 78 crore in 1950-51 to Rs 949 crores in 1965-66.
Recording a decline to Rs 99 crore in 1970-71, the extent of trade deficit rose from Rs 1,229 crore in 1975-76 to Rs 5,838 crore in 1980-81 and then considerably to Rs 10,640 crores in 1990-91. But after the introduction of some changes in the trade policy and due to considerable import compression the extent of trade deficit declined remarkably to Rs 3,809 crore in 1991-92.
Accordingly, the annual average deficit in balance of trade which Rs 108 crore during the First Plan gradually rose to Rs 747 crore during the Third Plan. But due to import compression and boosting exports, the annual average trade deficit declined to Rs 167 crore during the Fourth Plan.
But since then the annual average deficit in balance of trade rose significantly from Rs 810 crore during the Fifth Plan to Rs 5,716 crore during the Sixth Plan and then to Rs 7,720 crore during the Seventh Plan.
In 1992-93 the extent of trade deficit again rose to Rs 9,687 crore due to huge increase in import. But during 1993-94, the extent of trade deficit declined to Rs 3,350 crore due to considerable increase in exports. But during 2012-2013, the extent of trade deficit again rose to Rs 10,34,844 crore. Again during 2013-2014, the extent of trade deficit further rose to Rs 8,10,423 crore in 2013-14.
Essay # 3. Peculiarities of Foreign Trade during Eighties:
During 1980s, India’s foreign trade experienced following peculiarities:
1. The buoyancy in exports experienced during the Seventh Plan was mostly resulted from export promotion measures introduced by the government and also from depreciation in the exchange rate of rupee by 53.6 per cent (with 1980 as base) in March 1989.
Due to depreciation of rupee, the average growth in exports in terms of foreign exchange was much lower than the average growth in terms of rupee. Accordingly, during the Seventh Plan the average growth in export in U.S. dollar terms was 11.6 per cent in comparison to that of 19.8 per cent in terms of rupee.
2. The compound growth rate of imports during 1980s was 12.2 per cent as against the compound growth rate of about 17.0 per cent per annum in respect of exports. This peculiar situation exhibited in higher growth rate in exports and larger deficit in trade was resulted from a very low export base.
3. The share of exports in GDP in 1989-90 was 6.43 per cent as against its share of 4 to 5 per cent during 1985-86 to 1988-90.
4. The widening trade deficit in the country has been resulted not only from growing imports but also due to mounting import bills resulting from depreciation of the rupee. Moreover, rupee was depreciated more with those currencies with whom India’s share of foreign trade was maximum.
5. The export-import ratio (i.e., the extent of import finance by export) of the country has also improved during 1980s, i.e., from 53.5 per cent in 1980-81 to 55 per cent in 1985-86, and then to about 78 per cent in 1989-90.
Essay # 4. Composition of Foreign Trade in India:
The composition of foreign trade is an important indicator of the pattern of trade developed by country. By the term Composition of trade we mean the structural analysis involving the various types and the volume of various items of exports and imports of the country.
The composition of foreign trade of a country reflects on the diversification and specialisation attained in its productive structure along with its rate of progress and structural changes. The country exporting more of primary products, viz., raw materials and importing finished manufacturing goods and capital goods can be branded as an underdeveloped country.
With the passage of time a country attempts to change the pattern of trade in such a manner so that it can attain a better term of trade for its products by transforming the country from a primary producing one to a producer of finished manufactured products.
Composition of Imports in India:
Just at the dawn of independence, the import basket of India was mostly consisting of grains, pulses, oils, machineries, hardware’s, chemicals, drugs, dyes, yarns, paper, non-ferrous metals, vehicles etc. With the introduction of planning and with its emphasis on the development of basic, capital goods and engineering industries, the country had to import a huge quantity of capital equipment’s along with its spares known as maintenance imports.
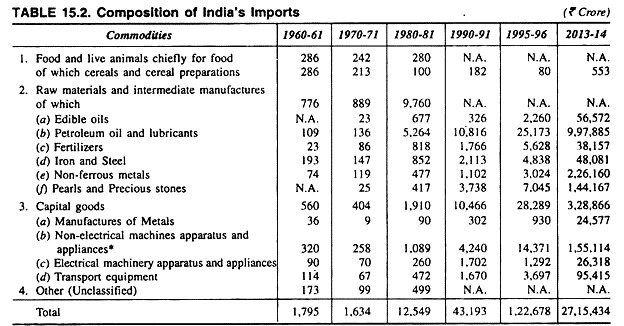
The following table shows the changes in the composition of imports in India since 1960-61:
Table 15.2 reveals that for better analysis, the imports of the country have been broadly divided into four groups:
(1) Food and live animals chiefly for food,
(2) Raw materials and intermediate manufactures,
(3) Capital goods and
(4) Other goods.
Table 15.2 further shows that in 1960-61 total value of imports was Rs 1,795 crore consisting of the share of above four groups as Rs 286 crore (15.9 per cent), Rs 776 crores (43.2 percent), Rs 560 crore (31.2 per cent) and Rs 173 crore (9.7 per cent) respectively.
Again in 1970-71, total value of imports of the country was Rs 1,634 crore and the share of the above four groups was 14.8 per cent, 54.3 per cent, 24.7 per cent and 6.2 per cent respectively. After 1970-71 total import bill of the country increased substantially due to a considerable hike in oil price by OPEC in 1973-74 and again in 1978-79.
The OPEC raised the prices of oil from $ 2.50 per barrel to $ 3 per barrel in 1973 and to 11.65 per barrel in 1974 and again $ 13.00 per barrel in 1978 and $ 35 per barrel in 1979. Due to this steep hike in the price of oil, total import bill of the country in 1980-81 increased sharply to Rs 12,549 crore out of which expenditure on petroleum oil and lubricants (POL) only was Rs 5,264 crore, i.e., 42 per cent of the total.
During the 1970s, POL imports recorded a considerable increase of about 44.2 per cent per annum as compared to that of 23.4 per cent per annum for all imports. Besides POL, higher rate of growth of imports was recorded by pearls, precious and semi-precious stones, fertilizers, iron and steel and capital goods in order of value during 1970s.
During 1980s, due to the introduction of import liberalisation policy by the government, import bill of the country rose considerably to Rs 19,658 crore in 1985-86 and to Rs 43,193 crore in 1990-91 and then finally to Rs 1,22,698 crore in 1992-93. Although there was a slight fall on the import bill on POL in 1985-86 but since 1987-88, import of POL both in terms of quantity and value started rising.
Total import of POL increased from 25.6 million tonnes in 1989-90 to about 29.3 million tonnes in 1990-91 and the total import bill on POL rose sharply to Rs 10,816 crore in 1990-91. In 2013-14 total import bill of the country rose to Rs 27,15,434 crore and the bill on import of POL rose sharply to Rs 9,97,885 crore.
Following are some of the important facts about the compositions of Indian imports:
(a) Import expenditure on POL rose significantly from Rs 136 crore in 1970-71 and then to Rs 9,97,885 crore in 2013-14. Official projections say that imports of POL will further go up in the coming year since the demand for petroleum products is expected to grow from 57 million tonnes in 1992-93 to about 100 million tonnes in 2000-01 and to about 160 million tonnes by 2013-2014 A.D.
(b) Imports of different types of capital goods also rose significantly from Rs 404 crore in 1970-71 to 3,28,866 crore in 2013-14 which amounted to about 12.11 per cent of total import in 2013-14.
(c) Import bill on pearls, precious and semi-precious stones also rose considerably from Rs 25 crore in 1970-71 to Rs 1,44,167 crore in 2013-14 and it amounted to nearly 5.30 per cent of total import in 2013-14.
(d) Import bill on fertilizer and fertilizer materials also rose considerably from Rs 86 crore. in 1970-71 to Rs 38,157 crore in 2013-14 and amounted to nearly 1.51 per cent of the total imports in 2013- 2014.
(e) Import bill on iron and steel rose considerably from Rs 197 crore in 1960-61 to Rs 48,081 crore in 2013-2014 and amounted to over 1.77 per cent of total imports in 2013-14.
Moreover, some other items which have been imported in India at low scale in recent years include food-grains and edible oil.
Composition of Exports in India:
At the dawn of independence, the export basket of the country was mostly consisting of jute, tea and cotton textiles, which jointly contributed more than 50 per cent of the total exports earning of the country. In 1950-51, these three commodities contributed about 60 per cent of the total export earnings of the country.
But this export of primary products is always disadvantageous as the terms of trade always go against the exporter country in this respect due to its inelastic demand in international markets.
With the gradual diversification and growth of the industrial sector, India started to export various types of non-traditional products. Accordingly the share of jute, tea and cotton textiles in the total export earning of the country gradually declined to 31 per cent in 1970-71 and then considerably to 3.46 per cent in 2013- 2014.
But the share of machinery and engineering goods in India’s total export increased gradually from a mere 2.1 per cent in 1960-61 to 12.9 per cent in 1970-71 and stood at 19.68 per cent in 2013-2014.
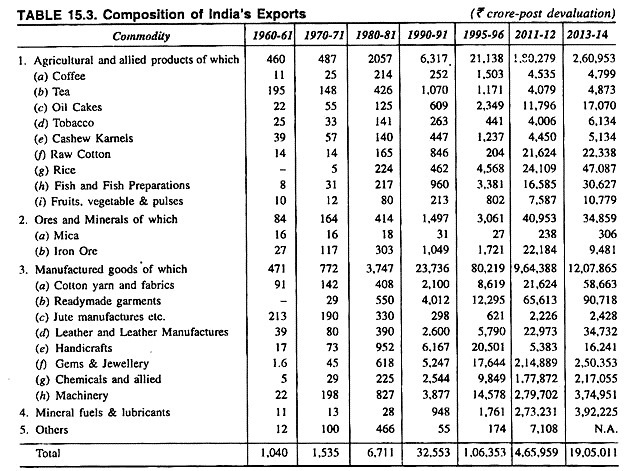
Table 15.3 shows the changes in the composition of export in India:
1. Jute was one of the most important export item initially and contributed Rs 213 crore, i.e., about 20 per cent of the total export earnings. But its share gradually declined to 12.4 per cent in 1970-71 and then to only 0.13 per cent in 2013-14.
2. Tea was second most important item of export which contributed Rs 187 crore (18.7 per cent of total export earnings) in 1960-61. Its share declined gradually to 9.6 per cent in 1970-71 and then to 3.3 per cent in 1990-91 and about 0.25 per cent in 2013-5014.
3. The share of cotton fabrics in total export earning of the country also declined marginally from 8.7 per cent in 1960-61 to 6.4 per cent in 1990-91 and 3.08 per cent in 2013-14.
4. Export of handicrafts rose considerably from a mere Rs 73 crore in 1970-71 to Rs 1,089 crore in 2012- 13 which constituted about 0.85 per cent of total export earnings in 2013-14 and occupied an important place.
5. Export of ready-made garments also increased considerably from Rs 29 crore in 1970-71 to Rs 90,718 crores in 2013-14 which constituted nearly 4.76 per cent of total export earnings in 2013- 14 and occupied fifth place.
6. Exports of machinery and engineering goods rose substantially from a mere Rs 22 crore in 1960-61 to Rs 3,74,951 crore in 2013-14, which constituted about 19.7 per cent of total earning in 2013-2014. It occupied second place.
Moreover, in recent years (2013-14) the exports of some other articles also increased considerably which include leather and leather manufactures (Rs 34,732 crore—7th place), chemicals and allied products (Rs 2,17,055 crore—4th place), iron ore (Rs 9,481 crore) etc.
Again the exports of the country have been broadly classified into five groups:
(i) Agriculture and allied products,
(ii) Ores and minerals,
(iii) Manufactured goods,
(iv) Mineral fuels and lubricants,
(v) Others.
The table shows that in 1970-71 total value of export was Rs 1,535 crore and the share of the above five groups was 31.7 per cent, 10.7 per cent, 50.2 per cent, 0.84 per cent and 6.5 per cent respectively. Again in 2013- 14, the share of these five groups in the country’s export trade changed to 13.70 per cent, 1.8 per cent, 63.4 per cent, 20.6 per cent and 0.48 per cent respectively.
Essay # 5. Directions of Foreign Trade in India:
Analysis of direction of trade reflects on regional direction of country’s foreign trade from where trade is originated. It would be quite important to analyse the direction of India’s foreign trade and the transformation that has taken place in details. In the pre-independence period, the direction of India’s foreign trade was determined by the colonial spirit prevailing between India and Britain.
Accordingly, India’s trade was mostly connected with Britain or its colonies or allies. After independence, this trend was continued for some years. As in 1950-51, U.K. and U.S.A. contributed about 42 per cent of India’s total export earning and about 39 per cent of India’s import requirement was met by these two countries.
At that time India had a very little trade connection with other capitalist countries like Germany, Italy, France etc. and had no trade relation with socialist countries like U.S.S.R., Poland, Czechoslovakia etc. With the passage of time, political and diplomatic relations were gradually established with various countries.
Thus the new trade relations were developed with various countries. In the mean time, after the completion of over six decades of planning, the direction of India’s trade has already recorded a remarkable change. Thus the direction of trade has been totally diversified.
Direction of Imports:
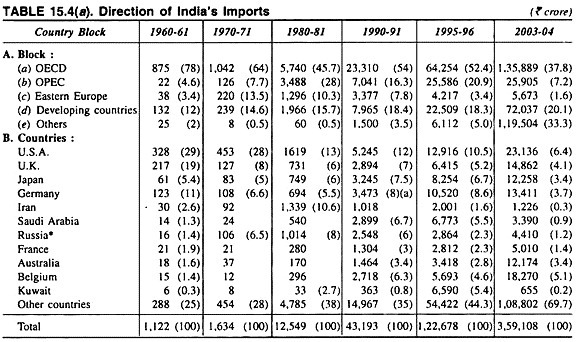
Direction of India’s imports has changed remarkably in the mean time. Table 15.4 (a) shows the changes in the direction of India’s imports since 1960-61.
Table 15.4 (a) shows that direction of India’s imports. If we study block-wise, then it can be seen that among the five blocks (i.e., OECD, OPEC, Eastern Europe, Developing countries and other countries) although the share of OECD countries in India’s imports was all along higher, but the same share gradually declined from 78 per cent in 1960-61 to 37.8 per cent in 2003-2.004.
The share of OPEC in India’s total imports gradually increased from 4.6 per cent in 1960-61 to 7.2 per cent in 2003-2004. The share of Eastern European countries in India’s imports which was only 3.4 per cent in 1960-61, gradually rose to 13.5 per cent in 1970-71 but since then its share gradually declined to 1.6 per cent in 2003-2004.
The share of developing countries in India’s imports gradually rose from 12 per cent in 1960-61 to 18.4 per cent in 1990-91 and stood at 20.1 per cent in 2003-2004. The share of other countries in India’s imports also gradually increased from 2.0 per cent in 1960-61 to 33.3 per cent in 2003-2004.
Now if we look at country wise figures then it can be seen that the share of U.K. in India’s imports which was 20.8 per cent (135 crore) being the highest among all the countries, gradually declined to 8 per cent in 1970-71 and then to only 4.1 per cent in 2003-2004.
The share of USA in India’s imports although remained all along highest since 1960-61 its share gradually increased initially from 18 per cent in 1950-51 to 29 per cent in 1960-61 and since then the share gradually declined to 6.4 per cent in 2003-2004. Thus it is found that since 1970-71 direction of trade recorded a continuous change where India’s dependence for imports from USA and U.K. gradually declined with the opening and expansion of trading relations with other countries like USSR, Japan, Germany, Belgium, Saudi Arabia etc.
Another important trend that can be seen is that since 1960-61 India’s trading relations with socialist countries particularly with USSR was expanded. Accordingly, the share of U.S.S.R. in India’s imports which was only 1.4 per cent (Rs 16 crore) in 1960-61 gradually rose to 8.2 per cent (Rs 1,014 crore) in 1980-81 and thus occupied third place.
Again in 1984-85, the share of USSR rose to 10.4 per cent and thus occupied first place in India’s imports. But the share of former USSR in India’s imports gradually declined to 6.0 per cent in 1990- 91 and then to only 1.2 per cent in 2003-2004.
In recent years, (i.e., 2003-2004) the other countries which have occupied a good share in India’s imports include Germany (3.7 per cent), Japan (3.4 per cent), Saudi Arabia, (0.9 per cent), Belgium (5.1 per cent), France (1.4 per cent) etc.
Direction of Imports by Regions and Countries in Recent years:
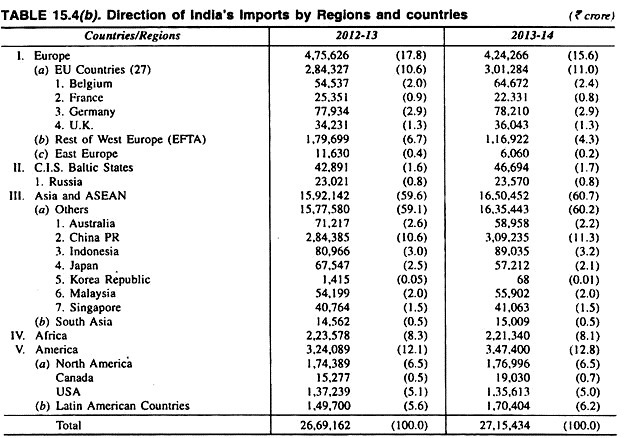
It would now be better to look at the direction of India’s imports by regions and countries in recent years on the basis of new classification and data prepared by Department of Commerce based on DGCI&S. Table 15.4(b) reveals the direction of India’s imports in recent years.
If we study region-wise then it can be seen that among the six regions, (i.e., West Europe, East Europe, CIS & Baltic States, Asia and ASEAN, Africa and America), the share of Asia and ASEAN in India’s imports remained all along highest, i.e., 59.2 per cent in 2012-13 and then it increased to 60.7 per cent of the total in 2013-14.
The share of Europe in India’s total imports was 17.8 per cent in 2012-13 which again marginally decreased to 15.6 per cent in 2013- 14. The share of America in India’s imports marginally declined from 12.1 per cent in 2012-13 to 12.8 per cent in 2013-14.
The share of Africa in India’s imports also marginally increased from 8.3 per cent in 2012- 13 to 8.1 per cent in 2013-14. Again the share of CIS and Baltic states in India’s imports which was only 1.6 per cent in 2012-13 marginally changed to 1.7 per cent in 2013-14.
Now if we look at country wise figures then it is observed that the share of U.K. in India’s imports increased from 1.3 per cent in 2012-13 to 1.3 per cent in 2013-14. The share of China PR in India’s imports in 2012-13 and 2013-14 increased from 10.6 to 11.3 per cent and that of USA decreased from 5.1 per cent in 2012-13 to 5.0 per cent in 2013-14.
Direction of Exports:
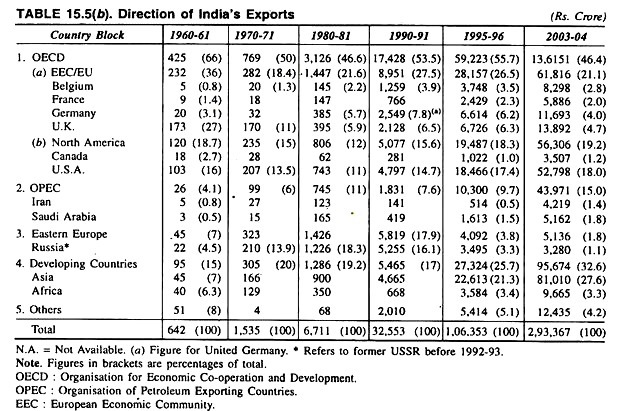
Direction of India’s exports has also recorded a remarkable change during these 4 decades of planning in the country. Table 15.5(a) shows direction of India’s exports since 1960-61. Table 15.5(a) reveals the direction of India’s exports since 1960-61.
If we study this direction of exports block-wise then it is found that among five blocks (i.e., OECD, OPEC, Eastern Europe, Developing countries and other countries) the share of OECD countries in India’s exports remained all along higher but its share gradually declined from 66.1 per cent in 1960-61 to 46.4 per cent in 2003-2004.
The share of OPEC countries marginally increased from 4.1 per cent in 1960-61 to 15.0 per cent in 2003-2004. But the most remarkable change in the direction of exports is noticed in respect of Eastern Europe whose share in India’s exports has increased remarkably from 7.0 per cent in 1960-61 to 22.1 per cent in 1980-81 and then it slowly declined to 17.9 per cent in 1990-91 and then to 1.8 per cent in 2003-2004.
The share of developing countries in India’s exports maintained a steady level, i.e., from 14.8 per cent in 1960-61 to 32.6 per cent in 2003-2004. Again among various countries, the share of U.K. in India’s total exports which was as high as 23.3 per cent in 1950-51 gradually rose to 26.9 per cent in 1960-61 (Rs 173 crore) and occupied first place in this respect.
But since then the share of U.K. declined sharply to 11.1 per cent in 1970-71 and then to 4.7 per cent in 2003-2004 (Rs 10,306 crore).
The share of U.S.A. in India’s exports remained all along steady and accordingly the share increased from 17.4 per cent in 1960-61 to 18.6 per cent in 1987-88 and then slightly declined to 18.0 per cent in 2003-2004. Thus the share of USA in India’s exports occupied first place since 1970-71.
Thus it is found that since 1970-71, the direction of India’s exports recorded a considerable changes with the diversification of exports markets for Indian goods among various countries of Eastern Europe, OPEC and other developing countries.
With the development of trading relations with socialist countries the share of USSR in India’s exports increased from 4.5 per cent in 1960-61 to 18.3 per cent in 1980-81 and then to 18.4 per cent in 1985-86 and thus occupied first place in these two years. But since then its share in India’s exports declined and reached the level of 1.1 per cent in 2003-2004.
In recent years (i.e., in 2003-2004) India has been able to expand its export net to some other countries. The countries which have occupied a good share in India’s exports include Japan (2.7 per cent), African countries (3.3 per cent), Belgium (2.8 per cent), Germany (4.0 per cent) etc.
In recent years, i.e., in 2013-14, the other countries which have occupied a good share in India’s imports include Belgium (2.4 per cent), Germany (2.9 per cent), Russia (0.8 per cent), Australia (2.2 per cent), Singapore (1.5 per cent), Japan (2.10 per cent), Korea Republic (0.01 per cent) etc..
Direction of Exports by Regions and Countries in Recent Years:
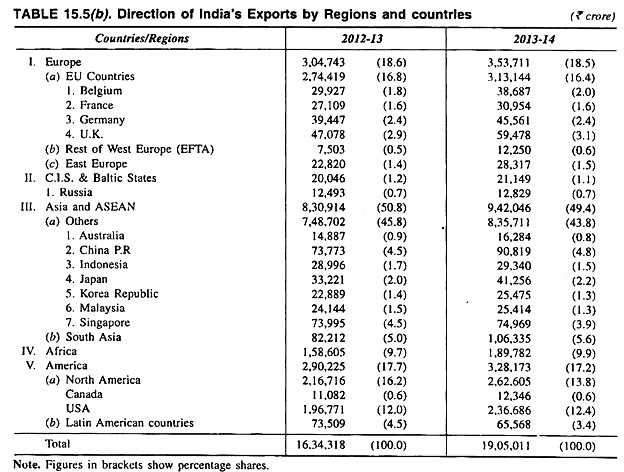
It would also be better to look -at the direction of India’s exports by regions and countries in recent years on the basis of new classification of regions and data prepared by Department of commerce based on DGCI&S.
Table 15.5(b) reveals the direction of India’s exports in recent years. If study region wise, then it can be seen that among the six regions (i.e., West Europe, East Europe, CIS & Baltic States, Asia and ASEAN, Africa and America), the share of Asia and ASEAN in India’s exports remained all along highest in recent years, i.e., 45.8 per cent in 2012-13 and then it slightly decreased to 43.8 per cent in 2013-14.
The share of Europe in India’s total exports was 18.6 per cent in 2012-13 and remained at 18.5 per cent in 2013-14. The share of America in India’s exports increased marginally from 17.7 per cent in 2012-13 to 17.2 per cent in 2013-14.
Again the share of Africa in India’s exports decreased from 9.7 per cent in 2012-13 to 9.9 per cent in 2013- 14. Again the share of CIS and Baltic States in India’s exports which was only 1.2 per cent in 2012-13 gradually declined to 1.1 per cent in 2013-14.
Moreover, if we look at country-wise figures, then it is observed that the share of U.K. in India’s exports in recent years declined marginally from 2.9 per cent in 2012-13 to 3.1 per cent in 2013-14. The share of USA in India’s exports increased marginally from 12.0 per cent in 2012-13 to 12.4 per cent in 2013-14.
The share of China P.R. in India’s exports also increased from 4.5 per cent in 2012-13 to 4.8 per cent in 2013-14. The share of Singapore in India’s exports decreased from 4.5 per cent in 2012-13 to 3.9 per cent in 2013-14.
In recent years, i.e., in 2013-14, other countries which have occupied a good share in India’s exports include Germany (2.4 per cent), Belgium (2.0 per cent), France (1.6 per cent), Russia (0.7 per cent), Japan (2.2 per cent).
Essay # 6. Foreign Trades Policy of India:
In the pre-independence period India did not have any clear cut trade policy but in specific cases adopted only import restriction viz., discriminating protection since 1923. After independence the Government adopted a trade policy as a component of policy on economic development of the country.
Features of Trade Policy of India:
In the initial stage in order to protect Indian industries from foreign competition the Government imposed restriction as a part of protective policy. Accordingly, the Government of India restricted the foreign competition through the system of import, licensing, import quotas, import duties and import ban on extreme cases.
After the adoption of Mahalnobis Model of development since the Second Plan a clear cut import policy became imperative on the following grounds:
(i) Complete or partial ban on the import of consumer goods,
(ii) Extensive control of various items of imports,
(iii) Liberal imports of capital goods for industrialisation, and
(iv) developing a suitable environment for adopting import substitution.
In respect of export, the Government adopted various decisions for promotion of exports through various fiscal and other incentives, and also by setting up some trading institutions. After the Second Plan, the Government undertook various export promotion measures in order to overcome its foreign exchange crisis and to attain the objective of self reliance.
Phases of Trade Policy of India:
For analytical purpose, the foreign trade policy of the Government can be divided in four phases: Phase I (1952-53 to 1956-57), Phase II (1956-67 to June 1966), Phase III (Devaluation of rupee and after) and Phase IV (after 1975-76).
During the first phase of the trade policy, liberalisation measures were taken both for imports and exports. As a result, imports increased remarkably but exports failed to keep pace with imports. During the second phase (1956-66) trade policy of the country was redesigned for meeting the requirements of planning.
Import controls and import substitution measures were incorporated and vigorous export promotion drive was launched through the diversification of exports. In this phase, the trade policy was reviewed by Mudaliar Committee.
During the third phase (after the devaluation of 1966), when the Government failed to achieve a good result in export promotion, the Government took resort to devaluation in June, 1966 in order to control imports and to boost its exports. Although the policy was not successful initially but started to show result since the Fourth Plan. This type of situation continued till 1975-76.
During the fourth and final phase (1975-76 and after), the Government adopted the policy of import liberalisation for encouraging export promotion. Again during the Janata rule, the Government adopted the policy of import liberalisation as a part of the programme of anti-inflationary import.
The import export policy of the Government aimed at:
(a) Providing incentive for export promotion,
(b) Providing support to the growth of indigenous industries,
(c) Optimum utilisation of resources
(d) Upgradation of technologies,
(e) Providing stimulus to export-oriented industries, and
(f) Imposing control on non-essential imports in order to save foreign currency.
In-spite of all attempts, the country had to face huge deficit in its balance of payments since 1979-80 onwards. Surprisingly the Tandon Committee (1981), under such a situation advocated for export promotion and further import liberalisation for achieving export promotion.
As this strategy was continued for tackling the balance of payments crisis of the country, thus in the absence of any fruitful result the country merged into a debt trap.
