Read this essay to learn about the population of India. After reading this essay you will learn about:- 1. Meaning of Population 2. Characteristics of Population 3. Life Table 4. Growth 5. Population Regulation 6. Population Fluctuation and Cycles 7. Population Fluctuation and Cycles 8. Interactions between Population 9. Human Population Trend in India 10. Global Human Population Vs. Resource Demand and Other Details.
Essay Contents:
- Essay on the Meaning of Population
- Essay on the Characteristics of Population
- Essay on the Life Table of Population
- Essay on the Growth of Population
- Essay on Population Regulation
- Essay on Population Fluctuation and Cycles
- Essay on Population Fluctuation and Cycles
- Essay on Interactions between Population
- Essay on Human Population Trend in India
- Essay on Global Human Population Vs. Resource Demand
- Essay on the Explosion of Population
- Essay on the Divisions of Population Regions in India
Essay # 1. Meaning of Population:
The term population has been interpreted in several ways, they are as follows:
i. In human demography, a population is a set of humans in a given area, such as village, town, city, state or country or even the whole world.
ii. In genetics, a population is a group of interbreeding individuals of the same species, which is isolated from other groups.
iii. In ecology, a population is a group of individuals of the same species, inhabiting the same area, and functioning as a unit of biotic community.
For example, all individuals of the common grass snails or pine trees, of particular habitats, constitute their population.
Organisms in a population undergo the same life cycle. They experience similar ecological process at a particular stage of the life cycle.
Populations can be defined at various spatial scales. For example, local population can occupy very small habitat patches, like a temporary pond of water. A set of local populations connected by dispersing individuals is called a meta-population.
Populations can also be considered at the scale of regions, islands, continents or oceans. Even the entire species can be treated as a population.
A population is composed of the individuals of a single species within a given area. A population’s boundaries may be natural ones, imposed by geographic limits of suitable habitat or they may be defined arbitrarily for the purpose of scientific study.
In either situation, a population has a structure, which includes features such as the density, spacing and movement of individuals, the proportion of individuals in different age, classes, genetic variation, and the arrangement and size of areas of suitable habitat, all of which may vary in time and space. Characterizing a population’s structure provides us with a snapshot of that population at one instant in time.
Ecologists refer to the geographic area in which species occurs as its geographic distribution or geographic range. The movement of organisms away from their place of birth or away from areas of high population concentration is referred to as dispersal. Distributional limits may be imposed by barriers to long distance dispersal movements.
An important measure of a population is the number of individuals. From management and conservation stand points it is important to understand the factors that cause population size to change and the processes that regulate those factors.
Essay # 2. Characteristics of Population:
A population has group characteristics, such as density, nasality (birth rate), mortality (death rate), dispersal, age distribution (i.e., ratio of one age group to the other), biotic potential and growth forms.
Populations are groups of individuals of the same species living in a particular place at the same time. They may differ in their number, patterns of living together, behaviour and organization. All of these factors are important when considering the interactions of a population with its environment and other populations.
The description of a population involves several parameters such as:
(i) The number and kind of individuals of a species,
(ii) A given space or an area, and
(iii) Time.
Density:
The number of individuals of a species living in a particular area is the density of that population. Density is dependent upon many factors, such as danger of predators and the availability of food, water, light, heat and nesting places. The density of a population increases when conditions are favourable to the populations and decreases when they are not favourable.
Population density is determined by counting all the individuals and dividing it by the number of units of space. For terrestrial organisms usually two dimensional units m2 (a quadrate of 1m × 1m) or soil surface are taken.
For aquatic organisms and organisms suspended in a medium, space is expressed in three dimensions (m3). If the total number of individuals is taken as N and the number of units of space as S, the population density D can be calculated as
D = N/S
For example, 50 individuals of a tree species may occur per hectare, or 70 individuals of the grass Cynodon per square metre. Density of plants is determined by counting individuals in sample units of predetermined sizes. Species density varies from time to time and from one area to another. For human population, counting is being done every ten years.
Distribution:
The arrangement of the individuals of a population within a particular space is called the distribution. While population density gives us knowledge that how many individuals exist in an area, whereas the distribution tells us how those individuals are arranged in that area.
The patterns of distribution are random, uniform and clumped. In random distribution organisms occur in no particular order. The organisms that are distributed in a uniform manner are spread evenly over an area, whereas the clumped organisms are concentrated at points throughout an area. Clusters may offer the population protection from enemies, wind and cold.
Essay # 3. Life Table of Population:
Populations have a spatial structure which includes the range of the species, the spatial arrangement of individuals within and among habitats within the range, population density, and patterns of movement of individuals.
Populations also have a genetic structure, which describes the genetic variation among individuals in the population and among sub-population or among different areas of a large continuous population. A third aspect of population structure has to do with the rates of births and deaths and the pattern of distribution of individuals among different age classes.
In order to construct a life table, one must first have knowledge of the age structure of the population that is, the number of different age classes and the number of individuals in each age class at some time. Age is designated in a life table by the symbol and age specific variables are indicated by the subscript.
Normally birth in life tables is also an important component, which could be computed by counting the number of female off-springs produced per breeding season or age interval per female in the population.
Life table also portray the statistics of mortality in several ways. The fundamental measure is the probability of survival or its alternatives the probability of death. When the number of individuals surviving to age (x) is expressed on a log scale and plotted against age, one obtained a survivorship curve (Fig 8.1).
Three hypothetical-survivorship curves were introduced by Pearl (1927). Few populations display one of these curves precisely, but the curves do provide a basis for comparison of population with different age structures and dynamics.
The type I curve, for example, depicts a situation with very low mortality among younger individuals, a situation that is characteristic of some human populations. Here population have more mortality in the older age class.
The type II curve, shows an extremely high mortality rate among young individuals, a pattern typical of many fishes, marine invertebrate and some human population.
The type III curve, shows steady state mortality with age as noticed in many individuals of plants and animals.
Four classes of population models are distinguished by discreteness of breeding episodes and overlap of generations. These are depicted in Table 8.1.
The dynamics of each type of population are modeled in a slightly different way. Those with non-overlapping generations are the simplest became they may be described by only two variables: survival from birth to reproduction and fecundity.
With overlapping generations, population models become more complex because each age class contributes differently in the dynamics of the population, and each individuals moves through progressively older age classes during its lifetime.
Essay # 4. Growth of Population:
A universal characteristics of living things is that sexually mature individuals have the ability to produce one or more offspring’s. Thus natural population have the ability to grow. The capacity for population growth is enormous, a fact that is sometimes clearly demonstrated when species are introduced to new regions having a habitat suitable for them.
For instance the human population began to expand rapidly after 1600, reaching 1 billion by the early 1800s doubling that number by 1930, and doubling again by 1975. By the late 1990s, the global population already reached over 6 million. If the current rates of population increase remain unchecked, we can expect the population to double to 12 billion in as little as 50 years.
Population growth is accompanied principally by reproduction, although populations may also increase in size by immigration (and may decrease in size by immigration and death). Populations grow like interest bearing bank accounts. Each time the account is compounded.
A population growing exponentially increase according to the equation—Nt = N0ert, where Nt is the number of individuals in the population after t unit of time, N0 is the initial population size (t = 0), and r is the exponential growth rate.
The constant e is the base of the natural logarithm’s, having a value of approximately 2.72. Exponential growth results in a continuous curve of increase (or decrease when the rt term is negative) whose slope varies in direct relations to the size of population (Fig. 8.2).
The rate of increase of a population undergoing exponential growth at a particular instant in time-—the instantion rate of increase—is the differential of the exponential equation; that is dN/ dt = rN
This equation encompasses two principles— (i) the exponential growth rate (r) expresses population increase (or decrease) on a per individual basis, (ii) the rate of increase (dN/dt) varies in direct proportion to the size of the population (N).
The individual, or per capita, contribution to population growth is the difference between the birth rate (b) and the death rate (d) calculated on a per capita basis. To see more clearly how the rate of increase of a population, dN/dt, is related to per capita birth and death rates, the exponential growth model is an appropriate representation of the growth of populations in which young are added to the population continuously (eg human population).
But in case where the young are added to the population only at specific time of the year, during discrete reproductive periods, the exponential model may not be the best representation of population growth.
In there cases, population growth is best represented by a geometric growth model. Returning to the idea of population growing like interest-bearing bank accounts, an account might be compounded annually, quarterly, daily or perhaps continuously, according to a particular bank’s practices.
Periodic compounding is an example of geometric growth, with increases posted at discrete intervals. The last case of continuous compounding, represents exponential growth.
In both the exponential and geometric growth models, birth and death rates were assumed to be uniform over all members of the population. That is, we assumed that an old individual has no more chance of dying than a young individual. In order to determine the size of the population in the future under such an assumption, one need only base the calculation on the total population size (N).
But when birth and death rates vary with respect to age, the contributions of younger and older individuals to population growth must be figured separately. The proportions of individuals in each age class in a population is referred to as the population’s age structure. Two populations with identical birth and death rates at corresponding ages, but with different age structures will grow at different rates.
Mathematicians use the techniques of matrix algebra, to organise and analyse sets of equations. These techniques have proved extremely useful in ecology as well—in particular, as a mean of efficiency projecting the growth of age structured and as we shall see below, stage classified populations.
The Lewis-Leslie matrix is an example of a single matrix model for population projection:
n0(t + 1) = n0(t) S0b1 + n1(t) S1b2 + n2(t) S2b3
n1(t + 1) = n0(t) S0 + n1(t) X0 + n2(t) X0
n2(t + 1) = n2(t) X0 + n1 (t) S1 + n2(t) X0
The above states matrix algebra thus provides a convenient way to summarise the operations depicted in these equations.
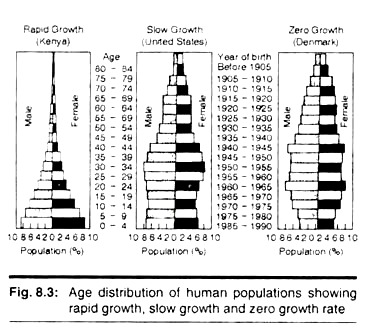
By careful assessment of age distribution in the population, one can assume the growth rate of the population (Fig. 8.3).
The intrinsic rate of increase of a population is strictly determined by the life table values, which express the interaction between individuals and their environment.
Essay # 5. Population Regulation:
What regulates populations? These questions have a long history in ecology, arising even before the time of Darwin and form the basis of a good deal of ecological theory and experimentation. In general in order for a population to grow, the birth rate plus the rate at which individuals immigrate into the population from other population must be larger than the death rate plus the rate at which individuals leave the population.
In single terms, the rate of input of individuals to the population (birth and immigration) must be greater than the rate of output of individuals (death and immigration). Any factor that diminishes inputs relative to outputs may act to regulate the population. Such factors may derive from everyday interactions among organisms, such as predation, herbivore and parasitism, or as in the case of plants, from the dynamics of resource used by individuals.
The intensity of such factors is most often related to the densities of the interacting populations. Other factors not related to how organisms interact may also regulate population, as when a severe storm or an exceptionally cold winter causes high mortality rates in all age classes of a population. Such factors tend to have effects unrelated to the density of the population.
Thus the complexity of population regulation arises from the fact that it is often difficult to determine what particular factor is most responsible for regulation, how various regulating factors interact, and whether regulation implies some equilibrium population size.
Meta-Populations:
Areas of habitat that contain the necessary resources and conditions for a population to persist are called habitat patches or simply patches. The individuals of a species that live in a habitat patch constitute a local population.
Because the habitat of any species is usually not distributed homogeneously in nature, a species may occur as a set of local populations, each occupying a patch separated from other patches by areas of unsuitable habitat.
Often there populations interact with one another through immigration and emigration. A set of local populations occupying an array of habitat patches and connected to one another by the movement of individuals among them is called meta-population or population of populations. Meta-populations are characterised by frequent extinctions of population patches followed by re-colonisation of those patches.
Essay # 6. Population Fluctuation and Cycles:
Variation in the density of a population depends on the magnitude of environmental fluctuation. Some populations exhibit regular cycle of density if environmental fluctuation is minimum. The age structure of a population may change through time due to variation in mortality among the various age classes.
Such changes may affect the rate of growth of the population. The carrying capacity of a population fluctuates in response to environmental variation. The extent to which the population responds to such changes depends on the rate of population increase.
The populations having high rates of growths track environmental variation more closely than populations with low rates of growth. Population biologists compare the responses of populations to change by their characteristic return time (T).
T is simply the inverse of the exponential rate of growth of a population free of the effects of crowding; hence T = 1/r. Except for fluctuations associated with daily, lunar (tidal) and seasonal cycles, environmental change tends to be irregular rather than periodic.
Historical records reveal that years of abundant rain or drought, extreme heat or cold or such natural disasters as fires and hurricanes occur irregularly, perhaps even at random. Biological response to these factors is similarly aperiodic.
Continuous time models can produce cyclic population change when the density-dependent response is time delayed. Many laboratory populations of animals exhibit oscillations that arise from delays in the response of individuals to population density.
Essay # 7. Extinction of Population; Conservation and Restoration of Population:
Extinction of species or population is a natural process. The fossil record reveals that global extinction events (i.e. mostly mass extinction) have occurred at least twice in the last 570 million years. It was also believed that we are in the midst of another mass extinction caused by rising human population and their activities.
Extinction may be caused by large disturbances, such as volcanic eruptions, fires or floods, by over-population of one species by another, and by population interactions such as predation and competition.
Extinction of native species may occur when non-native plants or animals are introduced into an area. Human may cause extinction by overpopulation or by destruction of habitat. Island populations become more vulnerable to extinction as they progress through the taxon cycle. It has been suggested that the competitive ability of species is diminished with population age.
Conservation of species in their native habitats needs very careful study. Many species could be restored back to their habitats with minimum effects. In such cases, the resilience of a population is the time that it takes for the population to return to equilibrium after it has been pushed from equilibrium by an environmental perturbation.
Long lived animals with large body sizes usually have a lower population resilience than the short lived and small-bodied animals. Managing the genetic diversity of small and endangered species is particularly important for the survival of those species.
Self-incompatibility in plants often results in isolated populations having only a single matting type. The restoration of such populations requires outcrossing with populations of different matting types; captive breeding programs are used in cases in which a natural population is extremely rare and endangered.
Essay # 8. Interactions between Population:
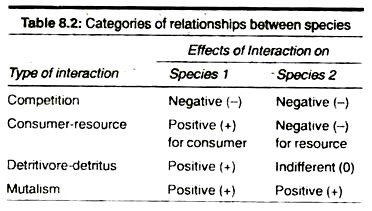
Many interactions between populations involve the consumption of resources. Competitive interactions involve several populations of consumers that varies from one or more resources. In some cases, such as predation, one of the participants in the interaction is the resource (prey) and the other is the consumer (predator).
Herbivores and parasites consume parts of their food plants or hosts. Mutualistic relationships, in which all participants benefit from the interactions, such as the relationship between plants and their pollinators, involve the production and consumption of a resource as part of the interaction.
Often the characteristics and availability of the resource shape the interaction. Population interaction may be generally classified according to whether the participants are negatively or positively affected by the interaction. In consumer-resource interactions, such as predation, one participant-benefit (consumer) and the other is harmed (resource).
In competitive interactions, both participants experience negative effects. In detritivore-detritus interactions, the detritivore enjoys a positive effect, whereas there is no effect on the detritus. All participants in mutualisms experience a positive effect (Table 8.2).
The logistic equation dN/dt = tN (1-N/k) maybe modified to form a simple model of a consumer-resource system in which the resource growth rate, dk/dt, is constant and the consumer growth rate, de/dt, is dependent on the rate of supply of the resource and the size of the consumer population. Such a model shows that an increased resource supply rate increases the carrying capacity of the consumer population.
Essay # 9. Human Population Trend in India:
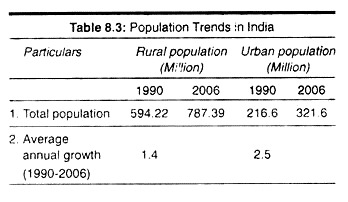
The world’s first national family-planning program began in India in 1952, when its population was nearly 400 million. In 2008, after 56 years of population control efforts, India was the world’s second most populated country with a population above 1000 million (Table 8.3).
The economic growth and human life style index has been very unimpressive during past few decades in-spite of a number of measures already taken up by the Government of India. Religious dogma, illiteracy and lack of social and political willingness for implementation of population control at grass root level are extremely deficient till today.
Essay # 10. Global Human Population Vs. Resource Demand:
Over global population which was 5.7 billion in 1994 will grow to a gigantic 9.1 billion by 2025 at the existing growth rate. In near future fossil fuel from oil fields will run dry. It will be impossible to meet agricultural demands from existing agro ecosystems. Global warming and climate changes will create adversities for life sustenance.
All these adverse situations can be avertable through population stabilisation and appropriate management of resource utilisation, resource renovation, and resource creation which are highly essential in 21st century.
There is a great disparity in resource availability and use between developed and developing countries, rich and poor nations. Thus international, national, regional conflict of resource sharing is seen in various parts of the globe. These problems have to be resolved through collective venture otherwise we cannot solve the global problems alone.
We have to change our life style in appropriate manner otherwise there will be constant crisis of resources. Mahatma Gandhi once stated that “earth has enough resources to meet our need, but never fulfill our greed”.
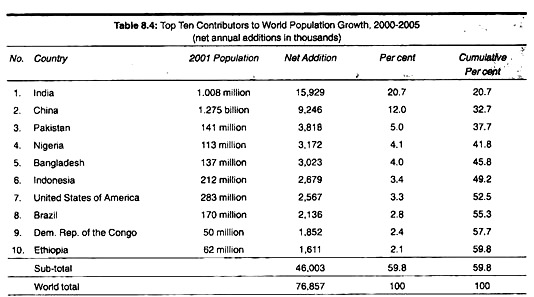
Details of top ten contributors of global population are give below (Table 8.4).
Essay # 11. Explosion of Population:
The unprecedented growth of human population at an alarming rate beyond carrying capacity is referred to as population explosion. In the 20th century, human population has grown tremendously. It is interesting to note that it took 1830 years for the world population to reach 1 billion, 100 years for 2 billion (1930), 30 years for 3 billion (1960), 26 years for 4 billion (1986) and 11 years for 5 billion (1997).
Now the world population grows by 10,000 each hour or 90 million per year that is, adding population of one Mexico each year.
The Indian Scenario:
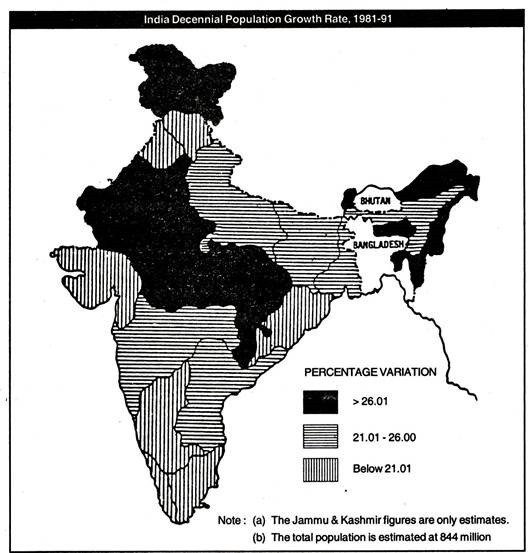
The statistics for Indian population is of serious concern. Post independent India in 35 years (1947-1981) literally added a second India, i.e., doubled its population (one in every seven will be an Indian). It has touched 1 billion mark on May 11th 2000 and 1.21 billion on 2010. If the current growth rate continues, India will have 1.63 billion people by 2025 and will become the most populous country surpassing China.
We have been overwhelmed by the population explosion since 1980 and that remains the core issue of our environment and economy. So we are heading for very serious ramifications of the population explosion problems.
Population crash is causing severe resource depletion and the ecological life support systems are getting jeopardized. There is a fierce debate on this issue as to whether we should immediately reduce fertility rate through world-wide birth control programmes in order to stabilize or whether man should devise new technologies for alternate resources, so that the problem of crossing the carrying capacity of the earth will never come.
Reasons for Population Explosion:
1. According to Malthus, starvation, poverty, disease, crime and misery are invariably associated with population explosion.
2. According to Karl Marx, social exploitation and oppression of the less privileged people leads to poverty, overcrowding, unemployment, environmental degradation which in turn causes over population.
Both of these factors seem to be interdependent and interrelated. Population crash is a time-bomb which must be diffused immediately. We have to dissociate the vicious P-triangle of Population-Poverty-Pollution on emergency basis. Equity and social justice to all is the need of the hour that can voluntarily help in achieving a stabilized global population.
Essay # 12. Divisions of Population Regions in India:
i. The Himalayan Mountain Region:
The complex Himalayan population distribution is totally controlled by the high altitude, complex geology, deep gorges, dense vegetation, harsh climate and low resource generation. This area is very sparsely populated, less than any other area in India. In this vast expanse of mountainous area, only vale of Kashmir and Jammu region are perhaps having comparatively large agglomeration of settlement.
Along the banks of river Jhelum and urban areas of Srinagar, agricultural development and tourism industry provided handsome business to the settlers. Under the centripetal pull of the commercial activities, a large number of people came here to settle. Apart from agriculture and commercial development, easy communication through well- developed roadways has distinct influence on population growth of those region.
Jammu, the other populated area in the zone, is situated in comparatively low altitudes. The major economic activity of the Jammu people is agriculture. Besides these two place, entire Himalayan region is devoid of any significant settlement.
In fact, dearth of resource, difficulty in agricultural activity, unpredictable climate and communication bottle-neck stand as major hindrances for further settlement growth in the remote and inaccessible areas of the mountains. Only isolated hamlets are visible occasionally in the high altitudes.
Settlement pattern in the Himalayas are closely controlled by the presence of rivers. In certain instances, settlement patterns are similar with drainage pattern. In Himachal Himalaya, Chamba, Kulu and Kangra valley are moderately populated.
Within entire stretch of Kumaun or Garwal Himalaya, settlements are concentrated within 2,000 m. elevation. Beyond that level, only tribal groups and migratory herders are visible only in warm seasons.
ii. North-Eastern Hill Provinces:
Above the Brahmaputra valley in Assam, the entire hilly ranges of Meghalaya, Mizoram, Nagaland, Mikir and Makum hills and remote Arunachal Pradesh is one of the most sparsely populated regions in India. Vast regions of Arunachal Pradesh is practically uninhabited.
In Meghalaya’s inaccessible hills of Khasi, Garo and Jayantiya, population density is very low. Within the entire area, Shillong plateau and the adjacent region is densely populated because of administrative and commercial activities. Around Tura hills, settlements have sprang up along Someswari River.
The Mikir, Makum and Cachar hills are comparatively populous. Here, because of the practice of migratory or jhum cultivation, density of population varies considerably. In Nagaland, major settlements have been established around Kohima city. Most of the Naga villages are compact and practice self-sufficient subsistence economic activity.
iii. The Great Plains:
At least 340 million Indian people live in this vast alluvial plain of northern India. The Indus in the west, Ganga in the central and Brahmaputra valley in the east formed one of the best fertile terrains in the world and simultaneously providing shelter to the largest number of people in a single uninterrupted geographic zone.
This massive plain land may be sub-divided into several demographic regions. These are:
(1) Assam plain,
(2) Bengal plain,
(3) Bihar plain,
(4) Upper Ganga plain,
(5) Rohilkhand plain,
(6) Punjab-Haryana plain and
(7) Rajasthan plain.
Assam plain is the direct outcome of the fluvial depositional activity of mighty Brahmaputra river. This absolutely monotonous flat alluvial tract merge westward imperceptibly into the lower Bengal plain. The combined population of Brahmaputra and Barak valley are estimated at around 22 million in 1991 with overall density of 266 people per sq. km. Incoming of large-scale migrant people from adjacent country accelerated population growth in Assam over the last couple of decades.
The population distribution over the entire valley is fairly even. Almost all the alluvial region is inhabited by people primarily dependent on agriculture. It has been generally said that composition and growth of Assamese people was always disturbed by the influx of migrant people, not only from Bangladesh but also from other neighbouring States.
The Bengal plain was formed by the alluvial infilling of Hooghly river. It stretches from Brahmaputra plain in the east to middle Ganga plain in the west. Himalaya in the north and Bay of Bengal in the south demarcates its boundary.
Easy communication, rich fertile soil, sound industrial growth and economic development even in very early colonial period boosted population growth. Calcutta, as the nerve centre of the entire plain, is the home of nearly 10.86 million people in 1991. The population in the conurbation, along with numerous satellite towns, exceeds 20 million.
The Bihar plain extends from Rajmahal in the south to Motihari in the north. The Kosi and Mahanadi alluvial plain harbour the maximum population of Bihar. The other river valleys having considerable population are Gandak and Gogra. Population density in Bihar plain is one of the highest in India, ranging 500 people per sq. km. It secures third place in India, next to West Bengal and Kerala.
The Upper Ganga plain is one of the oldest seats of settlement. From time immemorial, different ethnic groups came to reign over this Hindi heartland of north India. Density of population over this region excess 470 persons per sq. km. It covers entire Uttar Pradesh.
The total population in this area exceeds 130 million. Along the rivers Ganga and Yamuna, famous ancient towns are located. Agra, New Delhi, Kanpur, Varanasi, Allahabad, Lucknow, Moradabad are predominant.
This upper Ganga plain, which is popularly known as Ganga-Yamuna doab, is drained by several of their tributaries and distributaries — Kali, Ghagra, Ramganga, Rapti, Sarda etc. High annual rainfall, fertile rich agricultural land and upcoming industrial agglomeration attracted people to settle in the upper Ganga plain from very ancient times.
The Rohilkhand plain, comprising the districts of Pilibhit, Bareilly, Badaun, Moradabad and Etawah, is comparatively less densely populated region than its eastern counterpart. The Khader land along Ramganga River are less fertile than remaining Uttar Pradesh.
Its south-eastern side, comprising the districts of Varanasi, Jaunpur, Pratapgarh and Allahabad is situated within higher rainfall zone. Therefore, it is having more population than the north. In the Abad region along the Gogra river banks, population density is higher.
In Punjab-Haryana plain, climatic condition is not very favourable for settlement. But the drainage network of Indus, its tributaries Sutlej, Beas and Ravi and their vast water resources compensated the extremity of climate. These mighty rivers were preferred by human settlers from prehistoric periods.
According to archeologists, the Aryans perhaps invaded India through this fertile plane. Even before that in this very region the Great Indus Civilization came into being. At present, this plain is the home of nearly 35 million people.
The population density in this region is also very high, varying between 350 to 400 persons per sq. km. The Bari Doab between Ravi and Beas is the most densely populated region in this plain. The influx of refugees after Partition in 1947, rapid development of agriculture and industry together with extension of irrigation facilities, proved to be the major reasons for the high growth rate and high density of population. The urban centres like Amritsar, Jalandhar, Taran Taran, Ludhiana, Hosiarpur, Gurudaspur grew up with large population concentration.
Rajasthan plain is one of the sparsely populated region within the Great Plains. This semi-arid and arid plain is the home of about 40 million people. Here, density of population per sq. km. is less than 130. The south-eastern part of the plain has a larger population, which gradually decreases towards the more dry areas of north-western region.
iv. The Central Highland Regions:
The central highland region is moderately populated. Due to its vast extension and different population structure the entire area may be sub-divided into several sub-regions:
(a) Malwa plateau,
(b) Bundelkhand plateau,
(c) Chotanagpur plateau,
(d) Chhattisgarh region,
(e) Mahendragiri,
(f) Karnataka plain,
(g) Telengana region and
(h) Coorg plateau.
The average elevation of the area lies between 500 to 1,000 metres. The fertility status of the soil is lower than that of the Great Plains but presence of organic matter and minerals in the soil support plant growth. As the region is situated in the scanty rainfall region, agricultural development is lagging far behind the northern Great Plains. This may be the reason for low population density in the region.
East of Aravalli range, the Malwa plateau in Madhya Pradesh is mostly forest-covered area composed of lava. This area is sparsely populated due to low economic development. Similarly, in Bundelkhand upland, the inaccessible nature of the terrain, badlands and the long ridges prevented development of large-scale settlement.
The Chotonagpur plateau area had long been the abode of tribal people. After initiation of mineral exploitation, population density is gradually increasing here. The largest population concentration occurs in the steel cities of Jamshedpur, Rourkela, Bokaro and metallurgical centre of Ranchi.
Chhattisgarh region of Satpura Hills has a lower density of population. Along Godavari, Wainganga and IndrÄvati rivers, tribal hamlets have developed. Raipur, Bilaspur and Jabalpur are the major urban centres where population density is considerable.
In the hills of Mahendragiri, population density is one of the lowest in the entire region. Most of the settlements are isolated and without having good communication network with the neighbouring settlements.
South of Deccan plateau, Karnataka plain is perhaps the most populous region within central highlands. Here, density of population even exceeds 225 persons per sq. km. This undulating plain is traversed by several rivers like Tungabhadra, Cauvery, Penner etc.
The largest urban concentration is found within Bangalore city. This region contains nearly 44 million people. In the east of Maharashtra, the Telengana plateau is another demographic zone, where about 66 million people resides. Here, population density exceeds 241 persons per sq. km.
In the extreme south-west, Coorg plateau in Kerala is one of the most densely populated region in India. Here, the plain land with occasional brackish water provides excellent opportunity of population growth. With numerous cities like Thiruvananthapuram, Quilon, Allepi, population in this region is 29 million with density of 745 persons per sq. km.
v. Deccan Trap:
This ancient plateau of Deccan, entirely formed by lava, is conspicuous because of the unusual step-like relief (trap) of the region. Rainfall varies between 50 to 120 cm and the area is drained by big rivers — Godavari, Bhima, Krishna and Tapti. This region is inhabited by more than 75 million people. Population density is moderate, 200-300 persons per sq. km.
Average density is about 250 persons per sq.km. The distribution of population within the region is very uneven. Larger concentration occurs in the adjoining regions of urban centres like Poona, Satara, Akola, Nasik, Sholapur etc.
vi. The Coastal Plains:
This narrow strip of land, 100-150 km wide, bordering Bay of Bengal on the east and Arabian Sea on the west, is an excellent fertile land providing every opportunity to settlement from ancient days. A number of rivers debouch either from the western hills, like the Mahanadi, Godavari, Krishna and Cauvery and their deltas. It is one of the most densely populated regions in India.
Regarding geology, topography, climate, soil, vegetation and population composition, coastal plains may be sub-divided into two distinct sub-regions, namely:
1. The Eastern coastal plain.
2. The Western coastal plain.
1. The Eastern coastal plain is again sub-divided into three sub-divisions. These are:
(i) The Utkal coastal plain,
(ii) The Andhra coastal plain,
(iii) The Tamil Nadu coastal plain.
(i) The Utkal plain is entirely drained by the Mahanadi River. This region is moderately populated, where the average population density varies between 310 to 400 people per sq. km. Here, width of the coast is wider. High degree of agricultural development may be regarded as the major reason for the dense settlement development. Population density is maximum in Puri and Balasore districts.
(ii) Andhra coastal plain has close resemblance with the Utkal plain. Here, width of the plain is lower, ranging 30-120 km. The orientation of Eastern Ghats range limits the growth of the plain in the westerly direction.
It is very interesting to note that, despite this vast expanse of plain in north-south direction along the coast, the number of urban centres and ports are fewer on the eastern coast. Vijayawada and Rajahmundry are the only two sprawling urban centres in the Andhra coast with considerable population concentration.
(iii) Further south the Andhra coast gradually merges with the Tamil Nadu coastal plain where population density is lower. Along the banks of the river Cauvery population concentration is greater. The urban facilities of Madras attracted a sizable population.
Further south, characteristic type of coastal plain changes with the changes of rainfall, vegetation and climate. In the Tamraparni valley, density of population greater. The development of several urban centres like Tuticorin and Tinnevalley lead to higher density of population.
2. Western coast is comparatively less wide than eastern coast.
Here, population density is also comparatively high in south and decreases in the north. From south to north this coast may be subdivided into three demographic regions:
(i) Malabar coast,
(ii) Kannada coast and
(iii) Konkan coast.
(i) In the extreme south, Malabar Coast in Kerala is one of the most densely populated regions in India. Heavy monsoonal downpour, a fertile land with occasional brackish water and development of plantation orchards provide livelihood to the inhabitants.
(ii) West-ward to Sahadri Mountains, along the Arabian Sea, the Kannada coast is situated to the north of Malabar Coast. Population density here is far less than Malabar Coast. At some places in this coast, its width is so little that it is very different to ascertain the actual area of Kannada coast.
(iii) Above the Kannada coast, the continuous narrow strip of plain between Western Ghats and Arabian Sea is known as the Konkan coast. A considerable portion of Konkan coast is very narrow. Population density is higher in the deltas of Mandvi and Juari river delta in Goa. The overall population density is moderate.
vii. Islands:
Numerous islands are situated within the Bay of Bengal and the Arabian Sea. Some Eire practically uninhabited, but few islands like Andaman & Nicobar, Lakshadweep, Daman etc., possess moderate to high population density. Among these regions, Lakshadweep records maximum population density of over 1,500 persons per sq. km.


